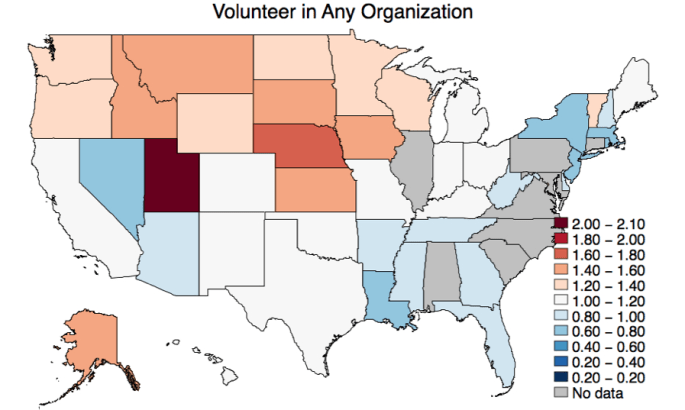
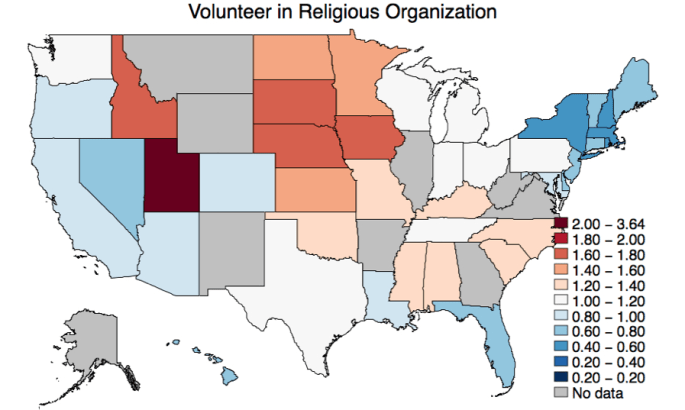
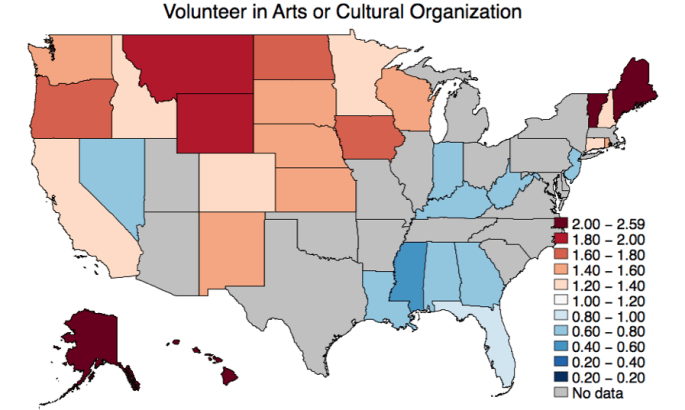
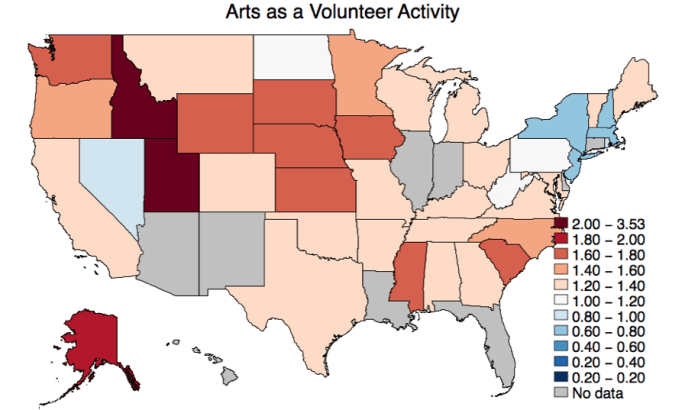
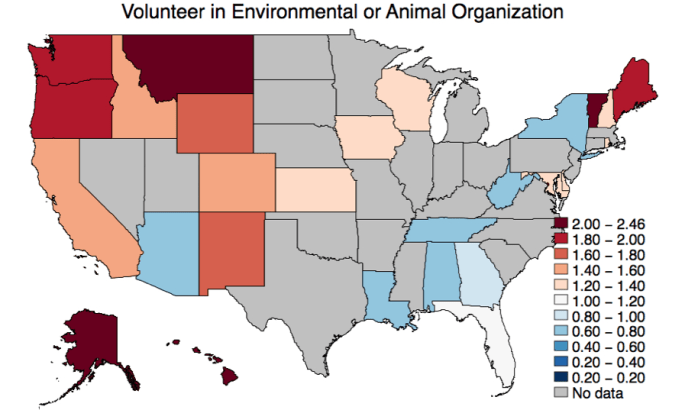
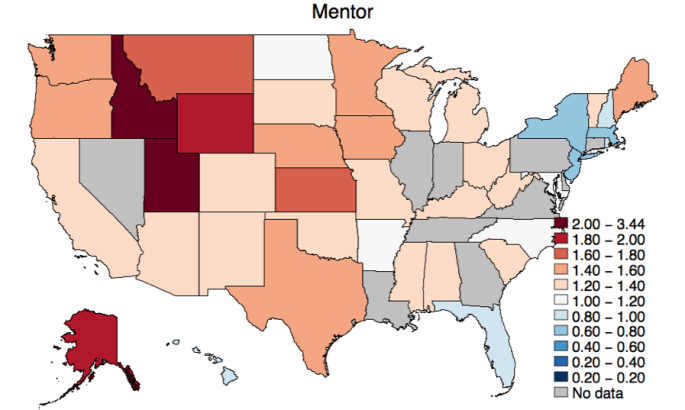
It should be noted that these maps reflect the state coefficient from a logistic regression. Illinois is the base state we compare to, so it’s logistic regression value is always 1, i.e. indicating “Illinois has 1 times the odds of Illinois”, which is a sentence that should always be true. A value greater than 1 indicates that residents of the state, all else being equal, have greater odds than Illinois of participating in a given volunteer activity. A value less than 1 indicates residents of a state have lesser odds than Illinois of participating in a given volunteer activity.
As a quick reference:
-Red states are more likely than our chosen “average state”, Illinois, to participate in a particular activity or organization. The deeper the red the more likely.
-Grey states are statistically indistinguishable from our “average state”, Illinois with regards to participating in a particular activity or organization
-Blue states are less likely than our average state, Illinois, to participate in a particular activity or organization. The deeper the blue, the less likely.